
Interaction to Next Paint (INP): The Complete 2026 Guide
Interaction to Next Paint replaced First Input Delay as a Core Web Vital in March 2024. It measures how responsive your website feels when someone clicks, taps or types — and it is now one of the most important SEO metrics you can fix.

What you'll learn
- →What INP measures and how it differs from First Input Delay (FID)
- →The three phases of an interaction: input delay, processing, and presentation
- →What causes poor INP scores and how to diagnose them
- →Practical optimization techniques for JavaScript-heavy pages
- →How to monitor INP with real user data and lab tools
When you click a button on a website and nothing happens for half a second, that's a poor INP experience. When you tap a menu and it opens instantly, that's a great one. Interaction to Next Paint (INP) captures exactly this — how quickly a page responds to user interactions throughout the entire visit.
What Is INP and Why Did It Replace FID?
First Input Delay (FID) only measured the delay of the very first interaction on a page. It missed everything that happened afterward — slow dropdown menus, unresponsive form fields, laggy scroll interactions. Most real-world frustration happens after the first click.
INP measures all interactions throughout the page session — clicks, taps, and keyboard inputs — and reports the worst one (approximately the 98th percentile). This gives a far more accurate picture of how responsive your site actually feels.
Good INP: Under 200ms
The page responds to interactions almost instantly. Users feel in control.
Needs Improvement: 200–500ms
Noticeable delays on some interactions. Users may feel slight sluggishness.
Poor INP: Over 500ms
Clear lag between user action and visual feedback. Users lose confidence in the site.
The Three Phases of Every Interaction
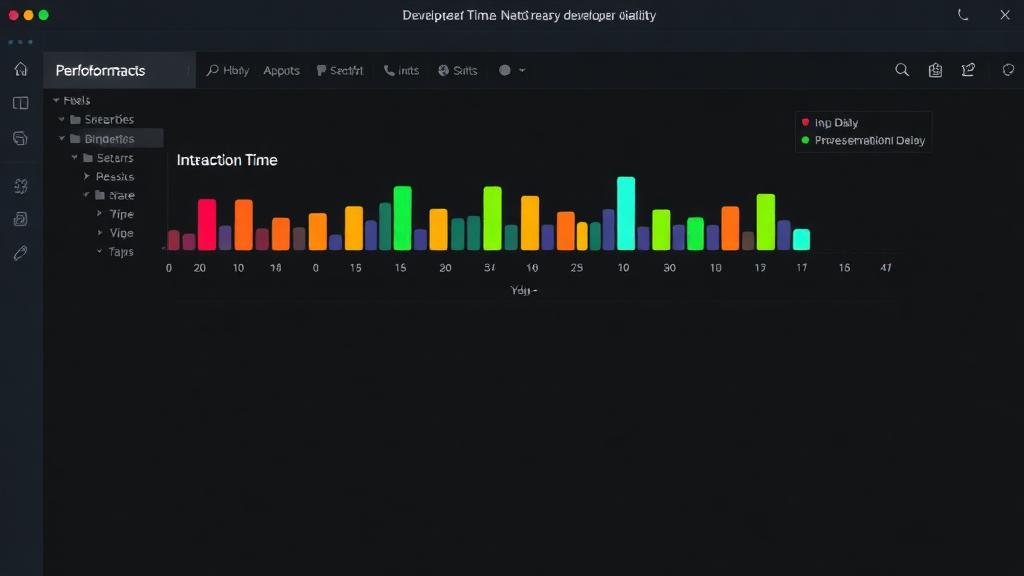
Every interaction consists of three distinct phases, and optimizing INP requires understanding all of them:
- Input Delay: The time between the user's action and when the browser begins processing the event handler. Long tasks on the main thread cause this.
- Processing Time: How long the event handler itself takes to execute. Complex calculations, DOM manipulation, or state updates contribute here.
- Presentation Delay: The time from when the handler finishes to when the browser renders the visual update. Style recalculations and layout thrashing cause this.
What Causes Poor INP Scores
The most common causes of poor INP in 2026 include:
- Long JavaScript tasks that block the main thread for more than 50ms
- Third-party scripts (analytics, chat widgets, ad tags) competing for main thread time
- Excessive DOM size — pages with 3000+ DOM elements slow down every interaction
- Synchronous layout calculations triggered by reading layout properties after DOM changes
- Hydration overhead in frameworks like React, Vue, and Angular during initial page load
How to Fix Poor INP
1. Break Up Long Tasks
Use requestIdleCallback, setTimeout, or the newer scheduler.yield() API to break long JavaScript tasks into smaller chunks. This allows the browser to process user interactions between chunks, dramatically reducing input delay.
2. Reduce Third-Party Impact
Audit your third-party scripts ruthlessly. Every analytics tag, social media embed, and marketing pixel competes for main thread time. Defer non-critical scripts, use loading="lazy" for embeds, and consider removing scripts that don't provide clear business value.
3. Optimize Event Handlers
Keep event handlers lean. Move heavy computation to Web Workers or defer non-visual work using requestAnimationFrame. Avoid reading layout properties (like offsetHeight) immediately after making DOM changes, as this forces expensive synchronous layout.
4. Reduce DOM Size
Large DOM trees slow down every style recalculation and layout update. Virtualize long lists, lazy-render off-screen content, and simplify nested component structures. Google recommends keeping total DOM elements under 1,400 for optimal performance.
How to Monitor INP
SnapSiteScan reports Total Blocking Time alongside LCP and CLS on every scan. TBT is the lab stand-in for INP: it comes from the same long-JavaScript-task problem, and fixing it is how you fix INP. INP itself cannot be measured in a lab test at all, because it requires real visitor interactions — for that, Chrome's CrUX field data (visible in Google Search Console and PageSpeed Insights) is the source.
Chrome DevTools' Performance panel lets you record interactions and inspect each phase of the INP breakdown — invaluable for debugging specific slow interactions.
The Bottom Line
INP is the Core Web Vital that most websites struggle with — but it's also the one that has the most direct impact on how your site feels to use. A website that responds instantly to every tap, click, and keystroke builds trust and keeps users engaged.
INP is your responsiveness report card. A great score means your site feels alive. A poor one means it feels broken.
Scan your website instantly and see what's slowing it down. For a full-picture review, read our complete website audit guide.
Related Articles
Check your INP score
See how responsive your website is and get actionable tips to improve interaction speed.
Scan Your Website Free