
What Is a Good PageSpeed Score in 2026?
You ran a speed test. You got a number. But is it actually good? Here's what PageSpeed scores really mean, what you should aim for, and why chasing 100 might be the wrong goal.

What you'll learn
- →What PageSpeed scores actually measure and how they're calculated
- →The score ranges: good, needs improvement, and poor
- →Why mobile and desktop scores are so different
- →Whether a perfect 100 score actually matters for SEO
- →Practical ways to improve your score today
Every website owner eventually asks the same question: "Is my PageSpeed score good enough?" It's a fair question, but the answer isn't as simple as a single number. A score of 72 on mobile might be excellent for a content-heavy e-commerce site, and terrible for a simple landing page. Context matters more than most people realize.
Let's cut through the confusion. This article explains exactly how PageSpeed scores work in 2026, what ranges you should target, and — perhaps most importantly — when to stop obsessing over the number and focus on what actually impacts your users and rankings.
How PageSpeed Scores Are Calculated
Google's PageSpeed Insights uses Lighthouse under the hood to generate a performance score from 0 to 100. That score is a weighted combination of six metrics, each measuring a different aspect of how your page loads and becomes interactive. If you want a deeper understanding of the underlying technology, our article on what PageSpeed Insights really does covers the technical details.
The six metrics and their current weights are: First Contentful Paint (10%), Largest Contentful Paint (25%), Total Blocking Time (30%), Cumulative Layout Shift (25%), Speed Index (10%). These weights shift periodically as Google updates Lighthouse — which is why your score can change even if your site hasn't.
Each metric is scored individually against a large dataset of real websites. Your page is essentially being ranked against the rest of the web. A metric that performs better than 90% of websites scores high; one that's worse than 75% scores low. The final number is a weighted average of all six.
The Score Ranges: What They Mean
Google divides scores into three color-coded categories. Green (90–100) means your page performs well. Orange (50–89) means there's room for improvement. Red (0–49) means your page has significant performance issues.
But here's the nuance most articles won't tell you: a "good" score depends entirely on your type of site. A static blog or portfolio site should absolutely aim for 90+. A complex web application with dynamic content, authentication, and third-party integrations will struggle to break 70 on mobile — and that might be perfectly acceptable.
The real question isn't "is my score green?" It's "are my Core Web Vitals passing?" Google uses field data from real users (Chrome User Experience Report) as a ranking signal — not your lab score. A site with a 75 Lighthouse score but passing Core Web Vitals in the field will outrank a site with a 95 score but failing CWV from real users.
What a 72 actually looks like
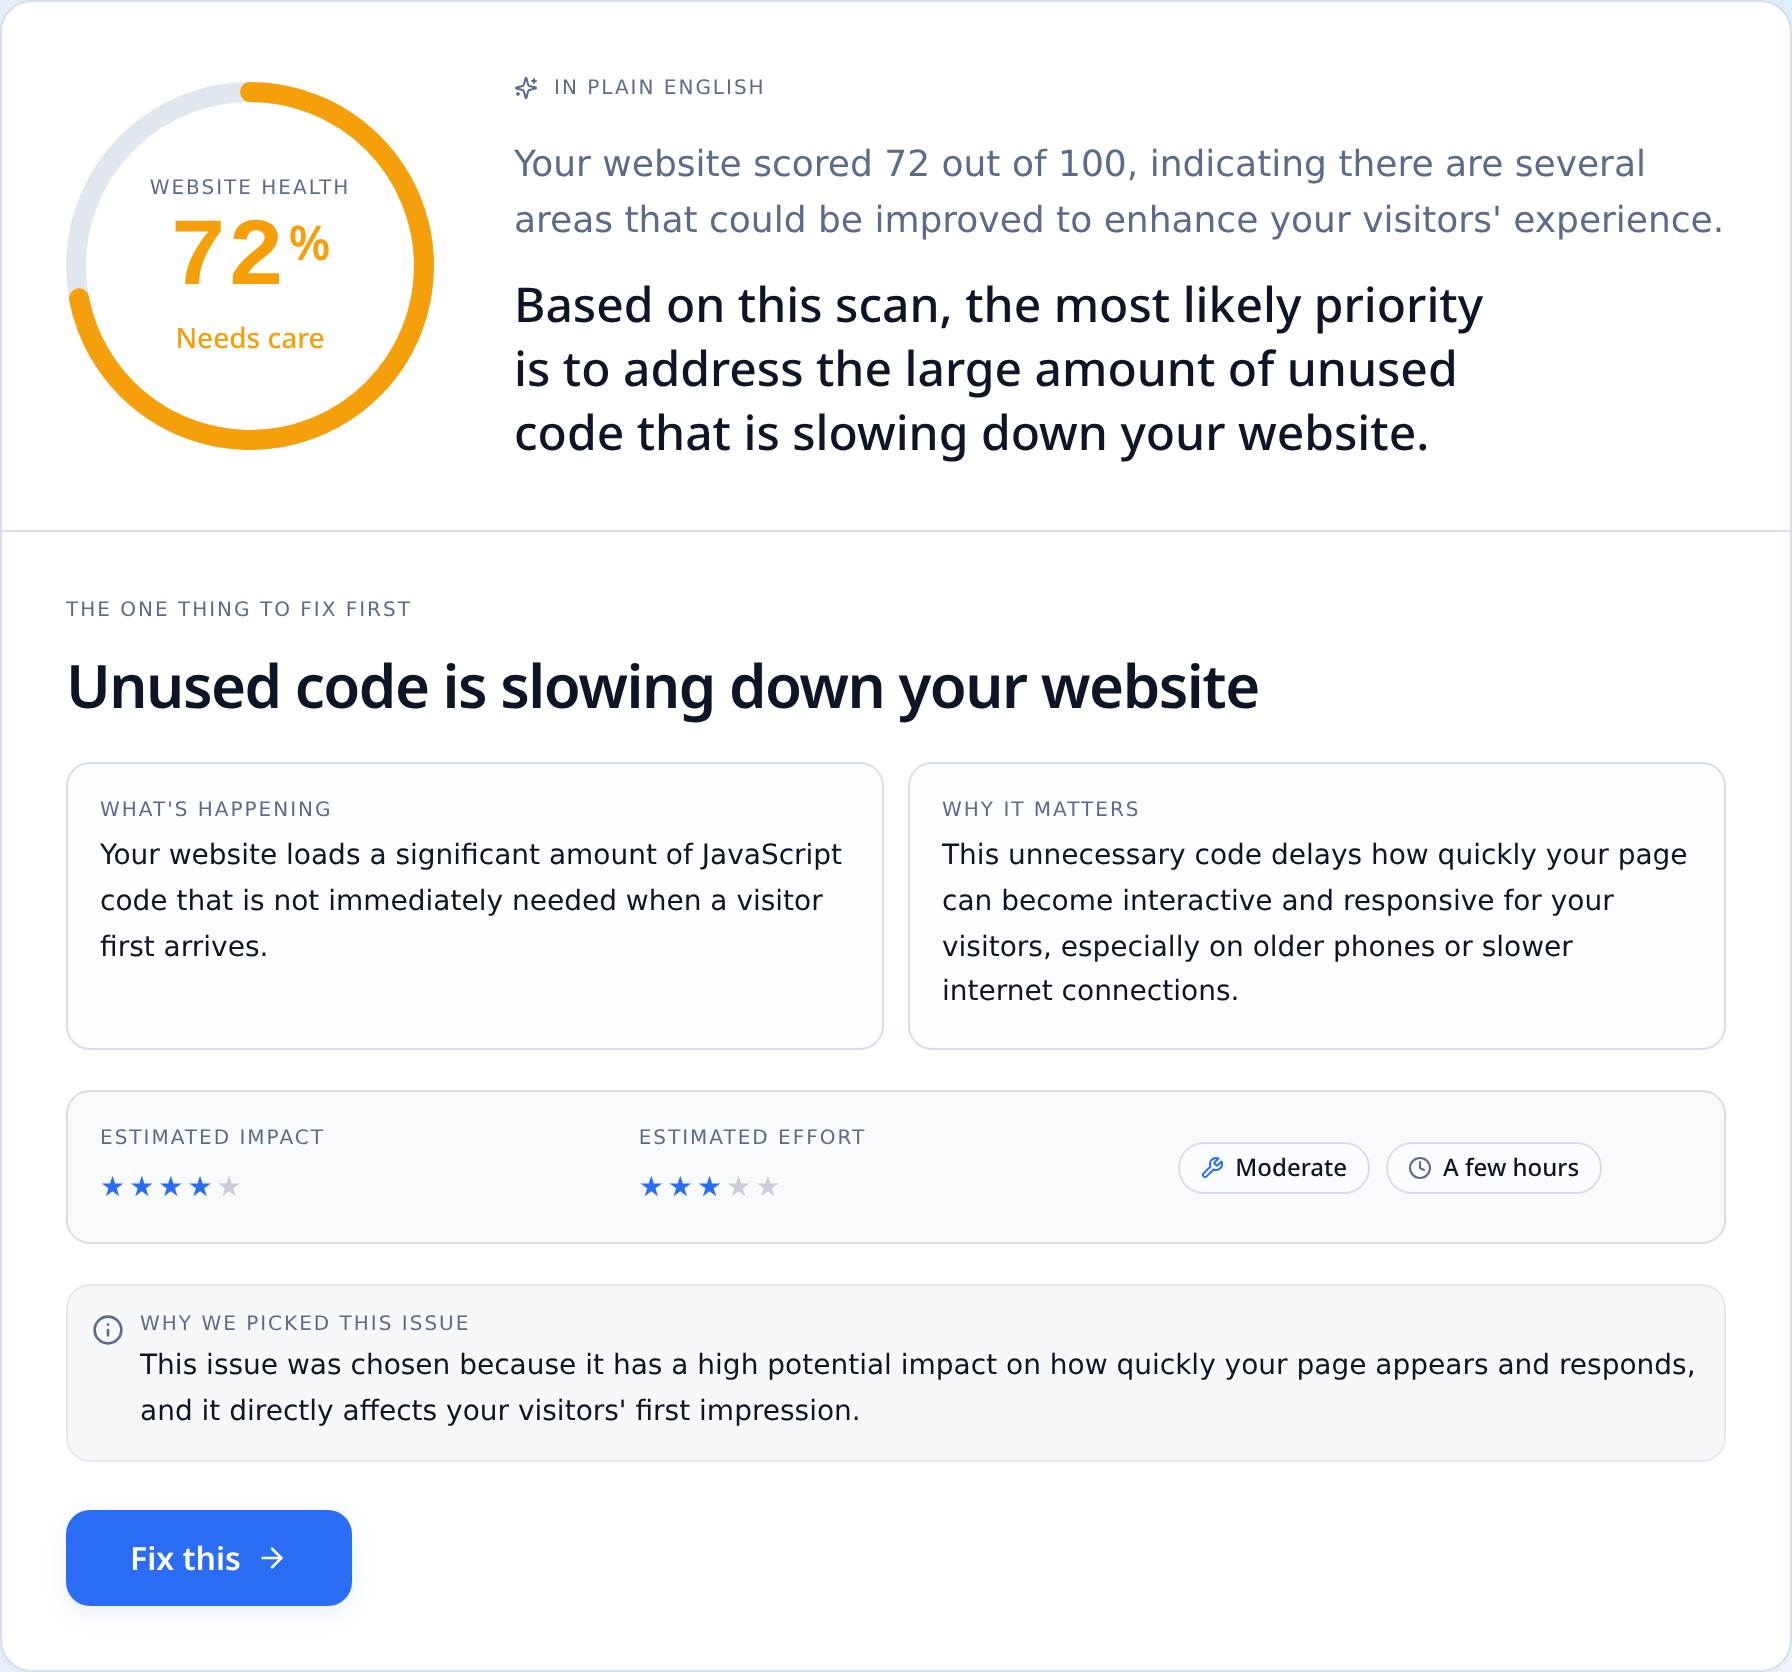
We ran stripe.com through our scanner while writing this article. It scored 72 — solidly in "needs improvement" territory. Here's exactly what that number looks like on a real, well-engineered site:
What this tells you
Even Stripe — with a dedicated performance team and CDN infrastructure most sites can only dream of — sits at 72 on mobile. That's not the number to panic about. The takeaway isn't "aim for 100"; it's "identify the single biggest drag" (here, unused JavaScript) and fix that first.
Why Mobile Scores Are Always Lower
If you've ever tested your site and seen a desktop score of 95 but a mobile score of 55, you're not alone. This is completely normal and happens because Lighthouse simulates a mid-range phone on a throttled 4G connection for mobile tests. Desktop tests assume a powerful computer on a fast connection.
The gap matters because Google uses mobile-first indexing. Your mobile score is what influences rankings, not your desktop score. This is why optimizing for mobile performance should always be your priority. Our guide on mobile vs desktop performance explains the differences in detail and how to close the gap.
For mobile, aim for 70+ as a realistic baseline. Getting above 80 puts you ahead of most competitors. Above 90 on mobile with real content is genuinely impressive and usually requires careful optimization of every asset on the page.
Does a Perfect 100 Matter?
Short answer: no. A score of 100 means you've optimized every lab metric to perfection, but it doesn't guarantee better rankings or more conversions than a score of 92. The difference between 90 and 100 is almost always insignificant in terms of actual user experience.
Chasing a perfect score can actually be counterproductive. You might remove useful analytics tools, strip out interactive features, or spend days shaving off milliseconds that no user will ever notice. That time is almost always better spent on content, UX, or addressing actual SEO issues that prevent indexing.
The sweet spot for most websites is between 85 and 95 on desktop, and 65 and 85 on mobile. If you're in that range with passing Core Web Vitals, your performance is not holding you back.
One number hides four different problems
The overall Website Health score is a rollup. The four Lighthouse categories underneath tell you which kind of problem you have — and they usually don't move together. Here's Stripe's breakdown from the same scan:
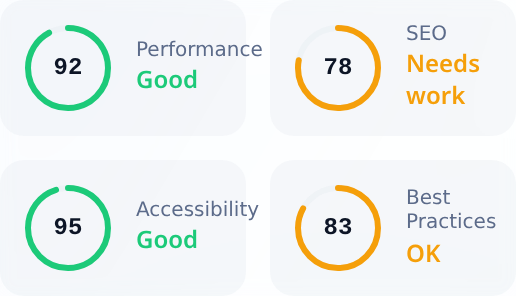
Loads and renders quickly on the tested device.
Missing crawlability signals — often meta tags or link-text quality.
Contrast, labels, and ARIA are mostly in order.
A few flagged console errors or deprecated APIs.
Notice the spread. A single "72" tells you nothing actionable — but seeing that Performance is 92 while SEO is 78 immediately points you at what to fix. Always look at the category breakdown before deciding where to spend engineering time.
How to Improve Your Score
If your score is lower than you'd like, start with the highest-impact optimizations. These typically give you the biggest score jumps with the least effort.
Optimize images. This is the single most common reason for poor scores. Convert images to WebP or AVIF format, resize them to the dimensions they're actually displayed at, and add lazy loading to images below the fold. This alone can improve your score by 10–20 points.
Reduce JavaScript. Total Blocking Time has the highest weight in the score calculation (30%). Every kilobyte of JavaScript your page loads has to be parsed, compiled, and executed. Remove unused libraries, defer non-critical scripts, and consider whether you really need that chat widget loading on every page.
Fix server response time. If your Time to First Byte (TTFB) is slow, everything else is delayed. A fast server and proper caching strategy lay the foundation for good performance. Our article on server response time explains why TTFB matters and how to improve it.
For a comprehensive list of speed improvements, check our guide on how to make your website faster. And if you want to prevent performance regression after improving, consider setting up performance budgets.
What Score Should You Actually Aim For?
Here's a practical framework based on site type:
Static sites and blogs: 90+ mobile, 95+ desktop. These are lightweight by nature, so there's no excuse for a poor score. If you're below 90, something is wrong — usually unoptimized images or unnecessary JavaScript.
Business and marketing sites: 75+ mobile, 90+ desktop. Third-party tools (analytics, chat widgets, CRM integrations) will always drag your mobile score down. Focus on keeping Core Web Vitals green.
E-commerce and web apps: 60+ mobile, 80+ desktop. Dynamic content and complex functionality make high scores harder. Prioritize real-user metrics over lab scores.
Regardless of your site type, run a scan with SnapSiteScan to see where you stand. The report breaks down exactly which metrics are pulling your score down and suggests specific fixes — sorted by impact so you know where to start.
The Bottom Line
A good PageSpeed score in 2026 isn't a specific number — it's a range that matches your site's complexity. Focus on passing Core Web Vitals with real-user data, aim for green on desktop and high orange on mobile, and spend your optimization time on changes that users will actually feel. The score is a compass, not a destination.
Scan your website instantly and see what's slowing it down.
Check your PageSpeed score now →Frequently Asked Questions
What is a good PageSpeed score in 2026?+
90 or above is considered good (green). 50-89 is needs improvement (orange). Below 50 is poor (red). Mobile scores are typically 10-20 points lower than desktop because tests simulate a mid-tier 4G phone.
Is a PageSpeed score of 70 acceptable?+
Acceptable, but not competitive. The median e-commerce site scores around 65-75 mobile. To beat competitors in Google's ranking, aim for 85+ on mobile.
Why does my mobile score differ from my desktop score?+
Lighthouse simulates a slower CPU and 4G connection on mobile. Heavy JavaScript, large images, and render-blocking resources hurt mobile scores far more than desktop. Google uses mobile-first indexing, so mobile is the score that matters most.
How fast can I improve my PageSpeed score?+
The top 3 fixes (image compression, removing unused JS, enabling gzip) can lift a score by 20-30 points in a few hours of work. Hitting 90+ usually requires a few days of focused optimization.